Question
Question: A photoelectric cell is connected to a source of variable potential difference, connected across it ...
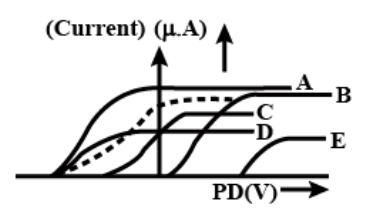
A photoelectric cell is connected to a source of variable potential difference, connected across it and the photoelectric current resulting (μA) is plotted against the applied potential difference (V). The graph in the broken line represents one for a given frequency and intensity of the incident radiation. If the frequency is increased and the intensity is reduced, then which of the following graphs of unbroken line represents the new situation?
Solution
We will solve this question by taking the relationship between intensity and frequency to the current and stopping potential for a photoelectric cell. We use the kinetic energy equation for electrons emitted from a photo electric cell by which we can obtain the stopping potential. Also the equation relating intensity of photon and the photoelectric current as intensity is proportional to the current.
Formula used:
K.Emax=hυ−ϕ0
Complete step by step answer:
We can look at the expression for maximum kinetic energy for a photoelectron. The potential difference is the potential we need to apply to make this kinetic energy 0. This is also known as stopping potential.
So as we increase the frequency, the kinetic energy will also increase because it is directly proportional to the applied frequency. So the potential difference will increase and the graph will move to the negative x-axis because as we are applying the stopping potential, it is taken as negative.
Now, we will look at the relation between intensity and current. Intensity of the given photon is directly proportional to the current generated.
i.e. Intensity∝Current
Here, intensity is reduced. So the current will also get reduced. So the graph will become smaller and move downwards through the positive y-axis.
So, we need the graph which is moved towards the negative x-axis and downwards on the y-axis. If we look at the graph given, the ideal choice is D. So the correct answer is option D.
Note:
Here, we are considering the change in potential difference as negative because the stopping potential is an energy externally applied. So, we will take it as negative and as frequency increasing, the more energy we will need to apply. So it moves left side to negative x-axis.