Question
Question: A particle of mass m is released from rest and follows a parabolic path as shown. Assuming that the ...
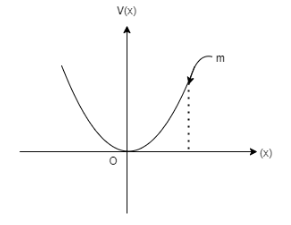
A particle of mass m is released from rest and follows a parabolic path as shown. Assuming that the displacement of mass from origin is small, which graph correctly depicts the position of the particle as a function of time?
A. 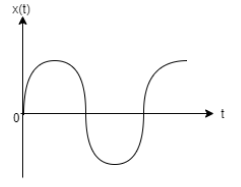
B. 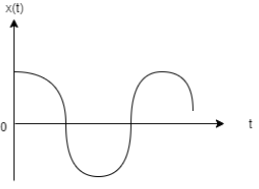
C. 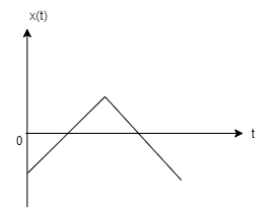
D. 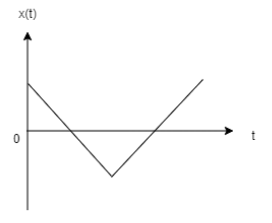
Solution
We are given a velocity displacement graph and it is mentioned that the particle is released from rest and follows a parabolic path, so our position time graph must start from origin. Also, we can make use of calculus to find out velocity from position.Alternative way is, this is a SHM problem. We can use a function to solve the problem which gives minimum velocity at mean position i.e. at origin.
Formula Used:
Here we have used the following equation to solve the problem x=Acos(wt+φ) where, A→amplitude, x→displacement, t→time, φ→phase
Complete step by step answer:
This given question is a Simple Harmonic Motion(SHM) problem. In the question it is said that the mass of the particle is m and when released from rest the mass follows a parabolic path. It is also stated that the displacement of mass from the origin is small. Now taking these informations into account we have to choose which graph correctly represents the displacement vs time curve.
So, the first thing that we note from the given curve is that the velocity at the mean position i.e., at the origin is 0. So, we should have some function that will give velocity to be 0 at the mean position. So, we take the displacement equation as:
x=Acos(wt+φ)
So, to get the velocity we must differentiate the previous equation with respect to time. Therefore,
V = \dfrac{{dx}}{{dt}} \\\
\Rightarrow V= \dfrac{d}{{dt}}(A\cos (wt + \varphi )) \\\
\Rightarrow V= - wA\sin (wt + \varphi )\\\
As it is previously stated that the function must be such that the velocity at mean position will be 0. Now we check whether the previous equation complies with that or not.So, at the mean position or origin time (t) is 0. So, in the previous equation if we take t=0 we get V=0 as, sin0∘=0. So, the previous equation complies with our criteria.Now as the function is taken as x=Acos(wt+φ) we must get a cosine curve. Now the cosine curve gives maximum value at t=0. So, the second option satisfies all the conditions and hence is the correct plot representing the motion.First option is incorrect because it is a sine curve and gives zero displacement at t=0. Third and fourth options are incorrect because they represent line curves and not cosine curves.
Hence, option (B) is correct.
Note: We could have also used x=Asin(wt+φ) as the function. But when we differentiate this function, we get
V=dtdx ⇒V=dtd(Asin(wt+φ)) ⇒V=wAcos(wt+φ)
As we have stated earlier that the function must be such that the velocity at mean position will be 0 this function does not comply with the criteria as cosine has maximum value at 0∘. So, we use x=Acos(wt+φ) instead of x=Asin(wt+φ).
