Question
Question: A Maxwell’s velocity distribution curve area under the graph A. Increases when temperature is incr...
A Maxwell’s velocity distribution curve area under the graph
A. Increases when temperature is increased
B. Decreases when temperature is increased
C. Remains same at all temperature
D. Depends on the pressure of the gas
Solution
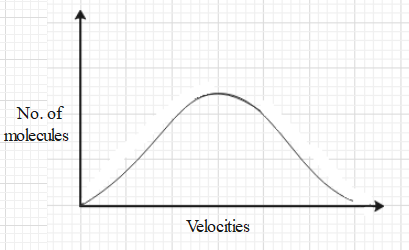
Maxwell’s distribution tells about the fraction of molecules of a given gas having a particular speed. The Maxwell’s distribution curve is a graph of the number of gas molecules versus the velocity that a molecule can have. The area under the curve represents the total number of molecules of the given gas.
Complete answer:
Let us first understand what a Maxwell’s distribution curve is.
Maxwell’s distribution tells about the fraction of molecules of a given gas having a particular speed. The Maxwell’s distribution curve is a graph of the number of gas molecules versus the velocity that a molecule can have.
The y axis represents the number of molecules and the x axis represents the velocity of the molecules.
If we want to find out what fraction of the total number of molecules have a certain speed at a given temperature then it can be done with the help of the graph.
Let us discuss the area under the curve. In this graph, the area under the curve will be equivalent to calculating the molecules of all the possible velocities. Therefore, the area under the curve represents the total number of molecules of the given gas.
However, the number of molecules is an independent quantity. Therefore, the number of molecules of a given gas will remain the same irrespective of the change in temperature.
So, the correct answer is “Option C”.
Note:
Note that the shape of the curve changes with the change in temperature. This is because the velocities of the gas molecules depend on the temperature. When the temperature is increased, the velocities of the gas molecules increase.
Hence, for a given gas the Maxwell’s distribution curve is different at different temperatures. However, the area under the curve is equal for all.