Question
Question: A hot liquid is kept inside in a big room. Rate of cooling of liquid is plotted against its temperat...
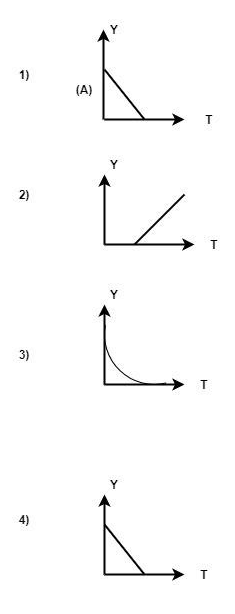
A hot liquid is kept inside in a big room. Rate of cooling of liquid is plotted against its temperature T. Which of the following curves may represent the plot?
Solution
Here we know that if we keep a hot liquid in a big room the temperature of the hot liquid falls down. Assume that the temperature of the room is at room temperature. Use Newton law of cooling and plot the graph and then match it with a given option.
Formula used: The rate of cooling of temperature is given by the formula:-
dtdQ=dxkA(ΔT) ;
Where:
dtdQ= Rate of change of heat=msΔT ; m = Mass; s = Specific Heat; ΔT= Change in temperature.
k= Constant;
ΔT/dx= Temperature gradient;
ΔT=dtdθ = Rate of change of Cooling.
A = Boundary Surface;
Complete step-by-step answer:
Plot the graph by Newton's law of cooling.
The formula is given as:
dtdQ=dxkA(ΔT)
Put the value of Q in the equation:
msΔT=dxkA(2θ1+θ2−θo); (ΔT=(2θ1+θ2−θo) )
Put the value of ΔT=dtdθin the above equation.
msdtdθ=dxkA(2θ1+θ2−θo);
Take me to the RHS and solve.
dtdθ=dx×mskA(2θ1+θ2−θo);
First find out the value of x,
Put the value of y =0,
At x we have a coordinatedx×mskAθo;
So we will get the graph for y i.e. the rate of cooling of temperature.
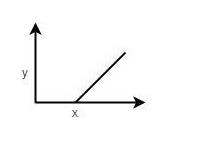
Final Answer: Option “2” is correct.
Note: Here, the intuitive answer would be option number3 but that is not the correct option. Here we have to apply the Newton law of cooling which has a specific formula and that has to apply in this question to get the desired graph.