Question
Question: A graph plotted by taking \({T^2}\) on \(y - \)axis and \(L\) on \(x - \)axis is an experiment of si...
A graph plotted by taking T2 on y−axis and L on x−axis is an experiment of simple pendulum is a straight the what relationship between T2 and L does the graph represent?
Solution
A simple pendulum always undergoes oscillatory motion. The only force acting on the pendulum is it’s self-weight. The pendulum’s time period is dependent on the length of the pendulum.
Complete answer:
Let us draw the free body diagram of the pendulum.
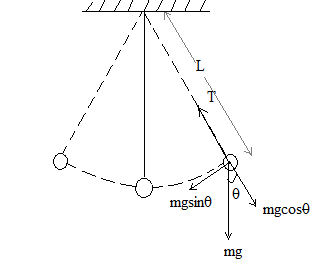
So let us assume that the angle θ is very small. Thus we can write;
s=L×θ
Here s is the displacement or arc length suspending the angle θ and length L.
Also the restoring force will be F≈mgθ ---------- 🡪( ∵θ≈0⇒sinθ≈θ )
Now substituting θ=Ls in the above equation we get;
⇒F=Lmgs
Now restoring force can be written as F=kx=ks as the displacement is s
Thus we get;
⇒k=Lmg
Now we know that the time period of oscillation is given by;
⇒T=2πkm
So, substituting the value of k in the equation we get;
⇒T=(Lmg)m
Thus simplifying the above equation we get;
⇒T=2πgL
Now, let us square both the sides of the above equation;
⇒T2=4π2gL
So, we can say that
⇒T2=aL where a=g4π2 is a positive constant.
The above equation is an equation of straight line.
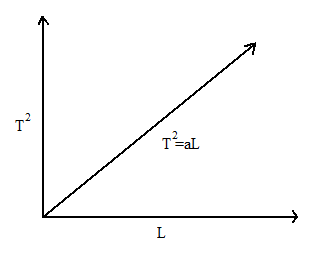
The above diagram is the graph of the T2 as ordinate and L as abscissa.
Thus we say that T2 increases with increase in L.
Note: The time period of a pendulum is independent of the mass of the pendulum and is only dependent on the length of the pendulum. Here we derived the equation for time period by assuming the angle is too small. The assumption θ≈sinθ is only possible when the angle is very small.