Question
Question: A graph of molar conductivity of three electrolytes (NaCl, HCl and NH4 OH) is plotted against $\sqrt...
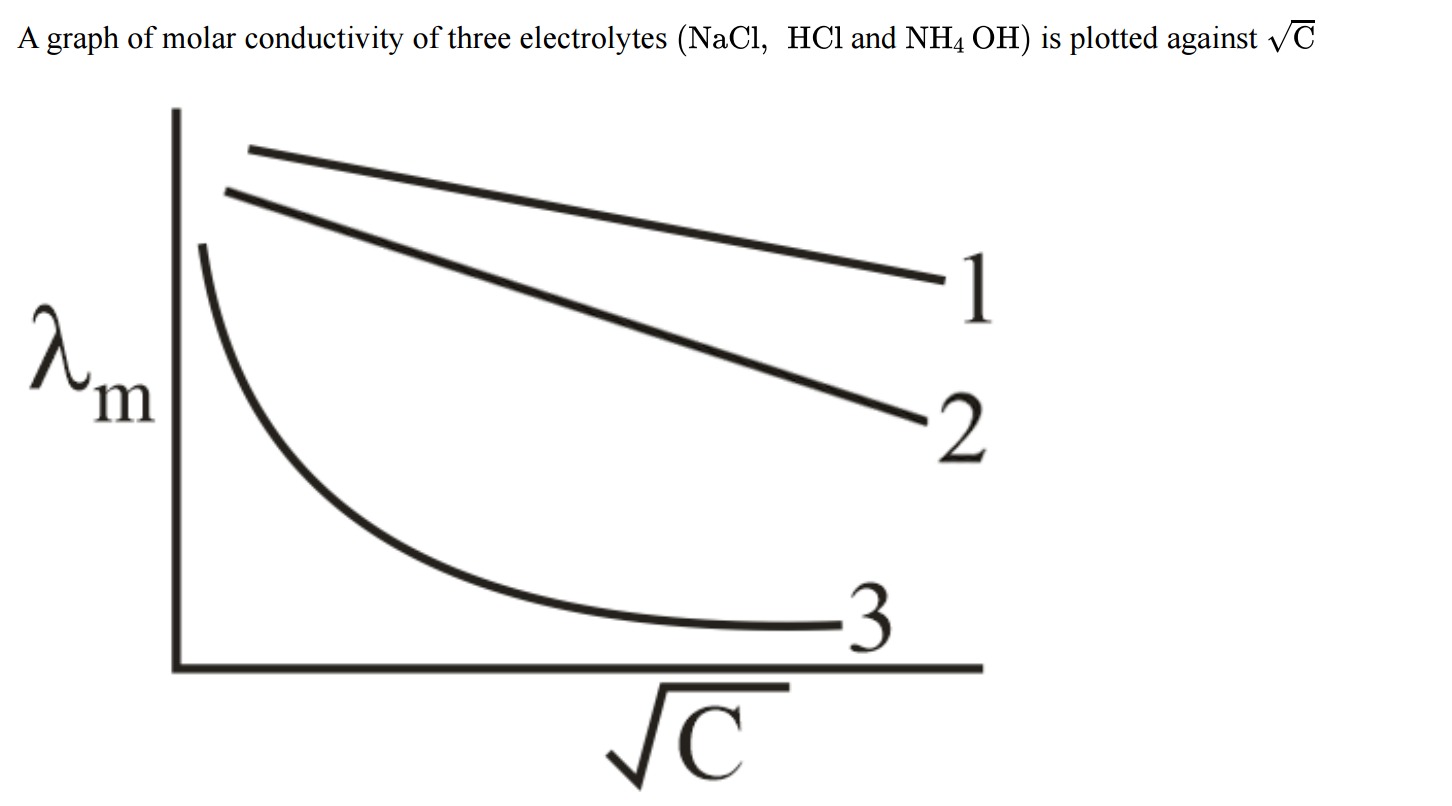
A graph of molar conductivity of three electrolytes (NaCl, HCl and NH4 OH) is plotted against C
λm
C
Answer
- Curve 1: HCl
- Curve 2: NaCl
- Curve 3: NH₄OH
Explanation
Solution
For strong electrolytes, Kohlrausch’s law applies:
Λm=Λm0−ACso their plots vs. C are straight lines. Among strong electrolytes, HCl has a very high limiting molar conductivity (due to the high mobility of H+) compared to NaCl. Therefore, the electrolyte with the highest y-intercept (Curve 1) is HCl and the one with the lower intercept (Curve 2) is NaCl. A weak electrolyte like NH4OH shows a non‐linear behavior (curved plot) as its degree of dissociation increases on dilution, which corresponds to Curve 3.