Question
Question: A graph is plotted between pressure and volume at different temperatures. On the basis of the graph ...
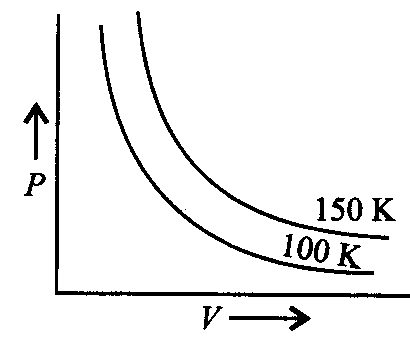
A graph is plotted between pressure and volume at different temperatures. On the basis of the graph what changes will you observe in the volume if
(i) The pressure is increased at constant temperature.
(ii) The temperature is decreased at constant
pressure.
A
Volume increases in both the cases
B
Volume decreases in both the cases
C
Volume increases in (i) and decreases in (ii)
D
Volume decreases in (i) and increases in (ii).
Answer
Volume decreases in both the cases
Explanation
Solution
: Volume decreases when pressure is increased at constant temperature when temperature is decreased at constant pressure, the volume decreases.