Question
Question: A frequency distribution of number of children in \(50\) families of a region is as under: Numbe...
A frequency distribution of number of children in 50 families of a region is as under:
| Number of Children (x) | 0 | 1 | 2 | 3 | Total |
|---|---|---|---|---|---|
| Number of families (f) | 10 | 25 | 12 | 3 | 50 |
Obtain ‘less than’ type and ‘more than’ type cumulative frequency distribution for these data.
Solution
In this question we have been given with the frequency distribution table for the number of children in 50 families. We have to Obtain ‘less than’ type and ‘more than’ type cumulative frequency distribution. We will solve this question by making the distribution with an upper-class limit and a lower-class limit. We will also find the cumulative frequency and plot the graph to get the required solution.
Complete step-by-step solution:
We have the distribution given to us as:
| Number of Children (x) | Number of families (f) |
|---|---|
| 0 | 10 |
| 1 | 25 |
| 2 | 12 |
| 3 | 3 |
| Total | 50 |
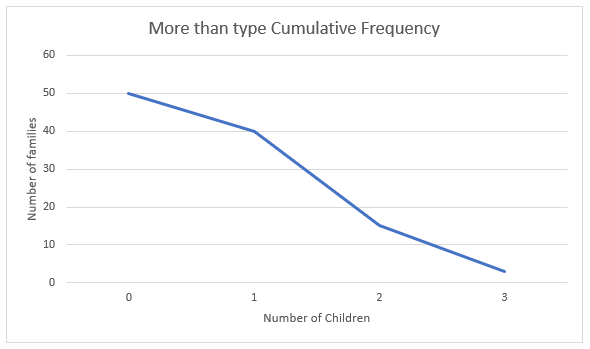
Now consider the more-than type cumulative frequency. To get the values for the more than type graph, we will find all the values in the table as more than. We will consider the class as more than 0, more than 1, more than 2 and more than 3.
We will also add the frequency of all the succeeding terms in the cumulative frequency of the terms.
We get the distribution as:
| Number of Children (x) | Cumulative frequency |
|---|---|
| More than 0 | 50 |
| More than 1 | 40 |
| More than 2 | 15 |
| More than 3 | 3 |
Now to find the more than type graph, we will plot the limits with the cumulative frequency. Therefore, we get the coordinates as:
(0,50),(1,40),(2,15),(3,3)
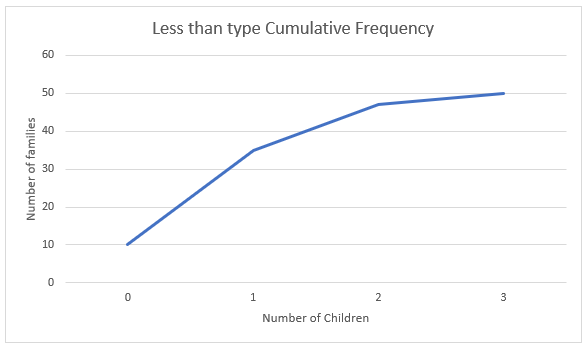
Now consider the less-than type cumulative frequency. To get the values for the less than type graph, we will find all the values in the table as less than. We will consider the class as less than 0, less than 1, less than 2 and less than 3.
We will also add the frequency of all the preceding terms in the cumulative frequency of the terms.
We get the distribution as:
| Number of Children (x) | Cumulative frequency |
|---|---|
| Less than 0 | 10 |
| Less than 1 | 35 |
| Less than 2 | 47 |
| Less than 3 | 50 |
Now to find the more than type graph, we will plot the limits with the cumulative frequency. Therefore, we get the coordinates as:
(0,10),(1,35),(2,47),(3,50)
Which is the required solution for the less than and more than type cumulative frequency graphs.
Note: It is to be remembered that the cumulative frequency should always be plotted on the Y-axis to get a correct ogive. It is to be that a cumulative frequency curve is also called an ogive. And it should be made using a free hand curve after plotting all the points on the graph. the cumulative frequency is to be added correctly for the correct ogive.