Question
Question: A dancer demonstrating dance steps along a straight line. The position time graph is given below. Fi...
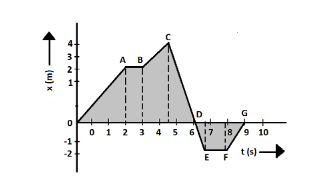
A dancer demonstrating dance steps along a straight line. The position time graph is given below. Find the average velocity of the dancer during a time interval between t = 4.5 s to t = 9 s.
A. 1ms−1
B. −1.33ms−1
C. 2.75ms−1
D. −0.89ms−1
Solution
To solve this question, we should remember some basic points of position-time graphs. The slope of position-time graph = small change in horizontal coordinatesmall change in vertical coordinate=dtdx= velocity at instant t.
Complete answer:
The graph between the time t and position x of a particle relative to a fixed origin is called the position-time graph. Its slope at any point gives the instantaneous velocity at that point.
Here, we have to find the average velocity during the interval, t = 4.5s to t = 9s.
At t = 4.5s,
Position of the dancer = 4m.
This is the initial position, i.e. xi=4m
At t = 9s,
Position of the dancer = 0m
This is the final position, i.e. xf=0m
So, change in position = xf−xi=0m−4m
⇒△x=−4m
Change in time = 9s – 4.5s
⇒△t=4.5s
Now, we know that,
Average velocity, v=△t△x
Putting the values, we will get
Average velocity, v=−0.89ms−1
So, the correct answer is “Option D”.
Note:
For a stationary object, the position-time graph is a straight line parallel to the time-axis. For a body in uniform motion, the position-time graph is a straight line inclined to the time-axis. For uniformly accelerated motion, the position-time graph is a parabola.
Additional information: The graph between time and velocity is called a velocity-time graph. Its slope at any point gives the acceleration at the corresponding instant. Distance covered in time t equals area under the velocity-time graph bounded by the time-axis.
1. for uniform motion, the velocity-time graph is a straight line parallel to the time-axis.
2. for uniform acceleration, the velocity-time graph is a straight line inclined to the time-axis.
3. for variable acceleration, the velocity-time graph is a curve.