Question
Question: A car is moving on a straight road. The velocity of the car varies with time as shown in the figure....
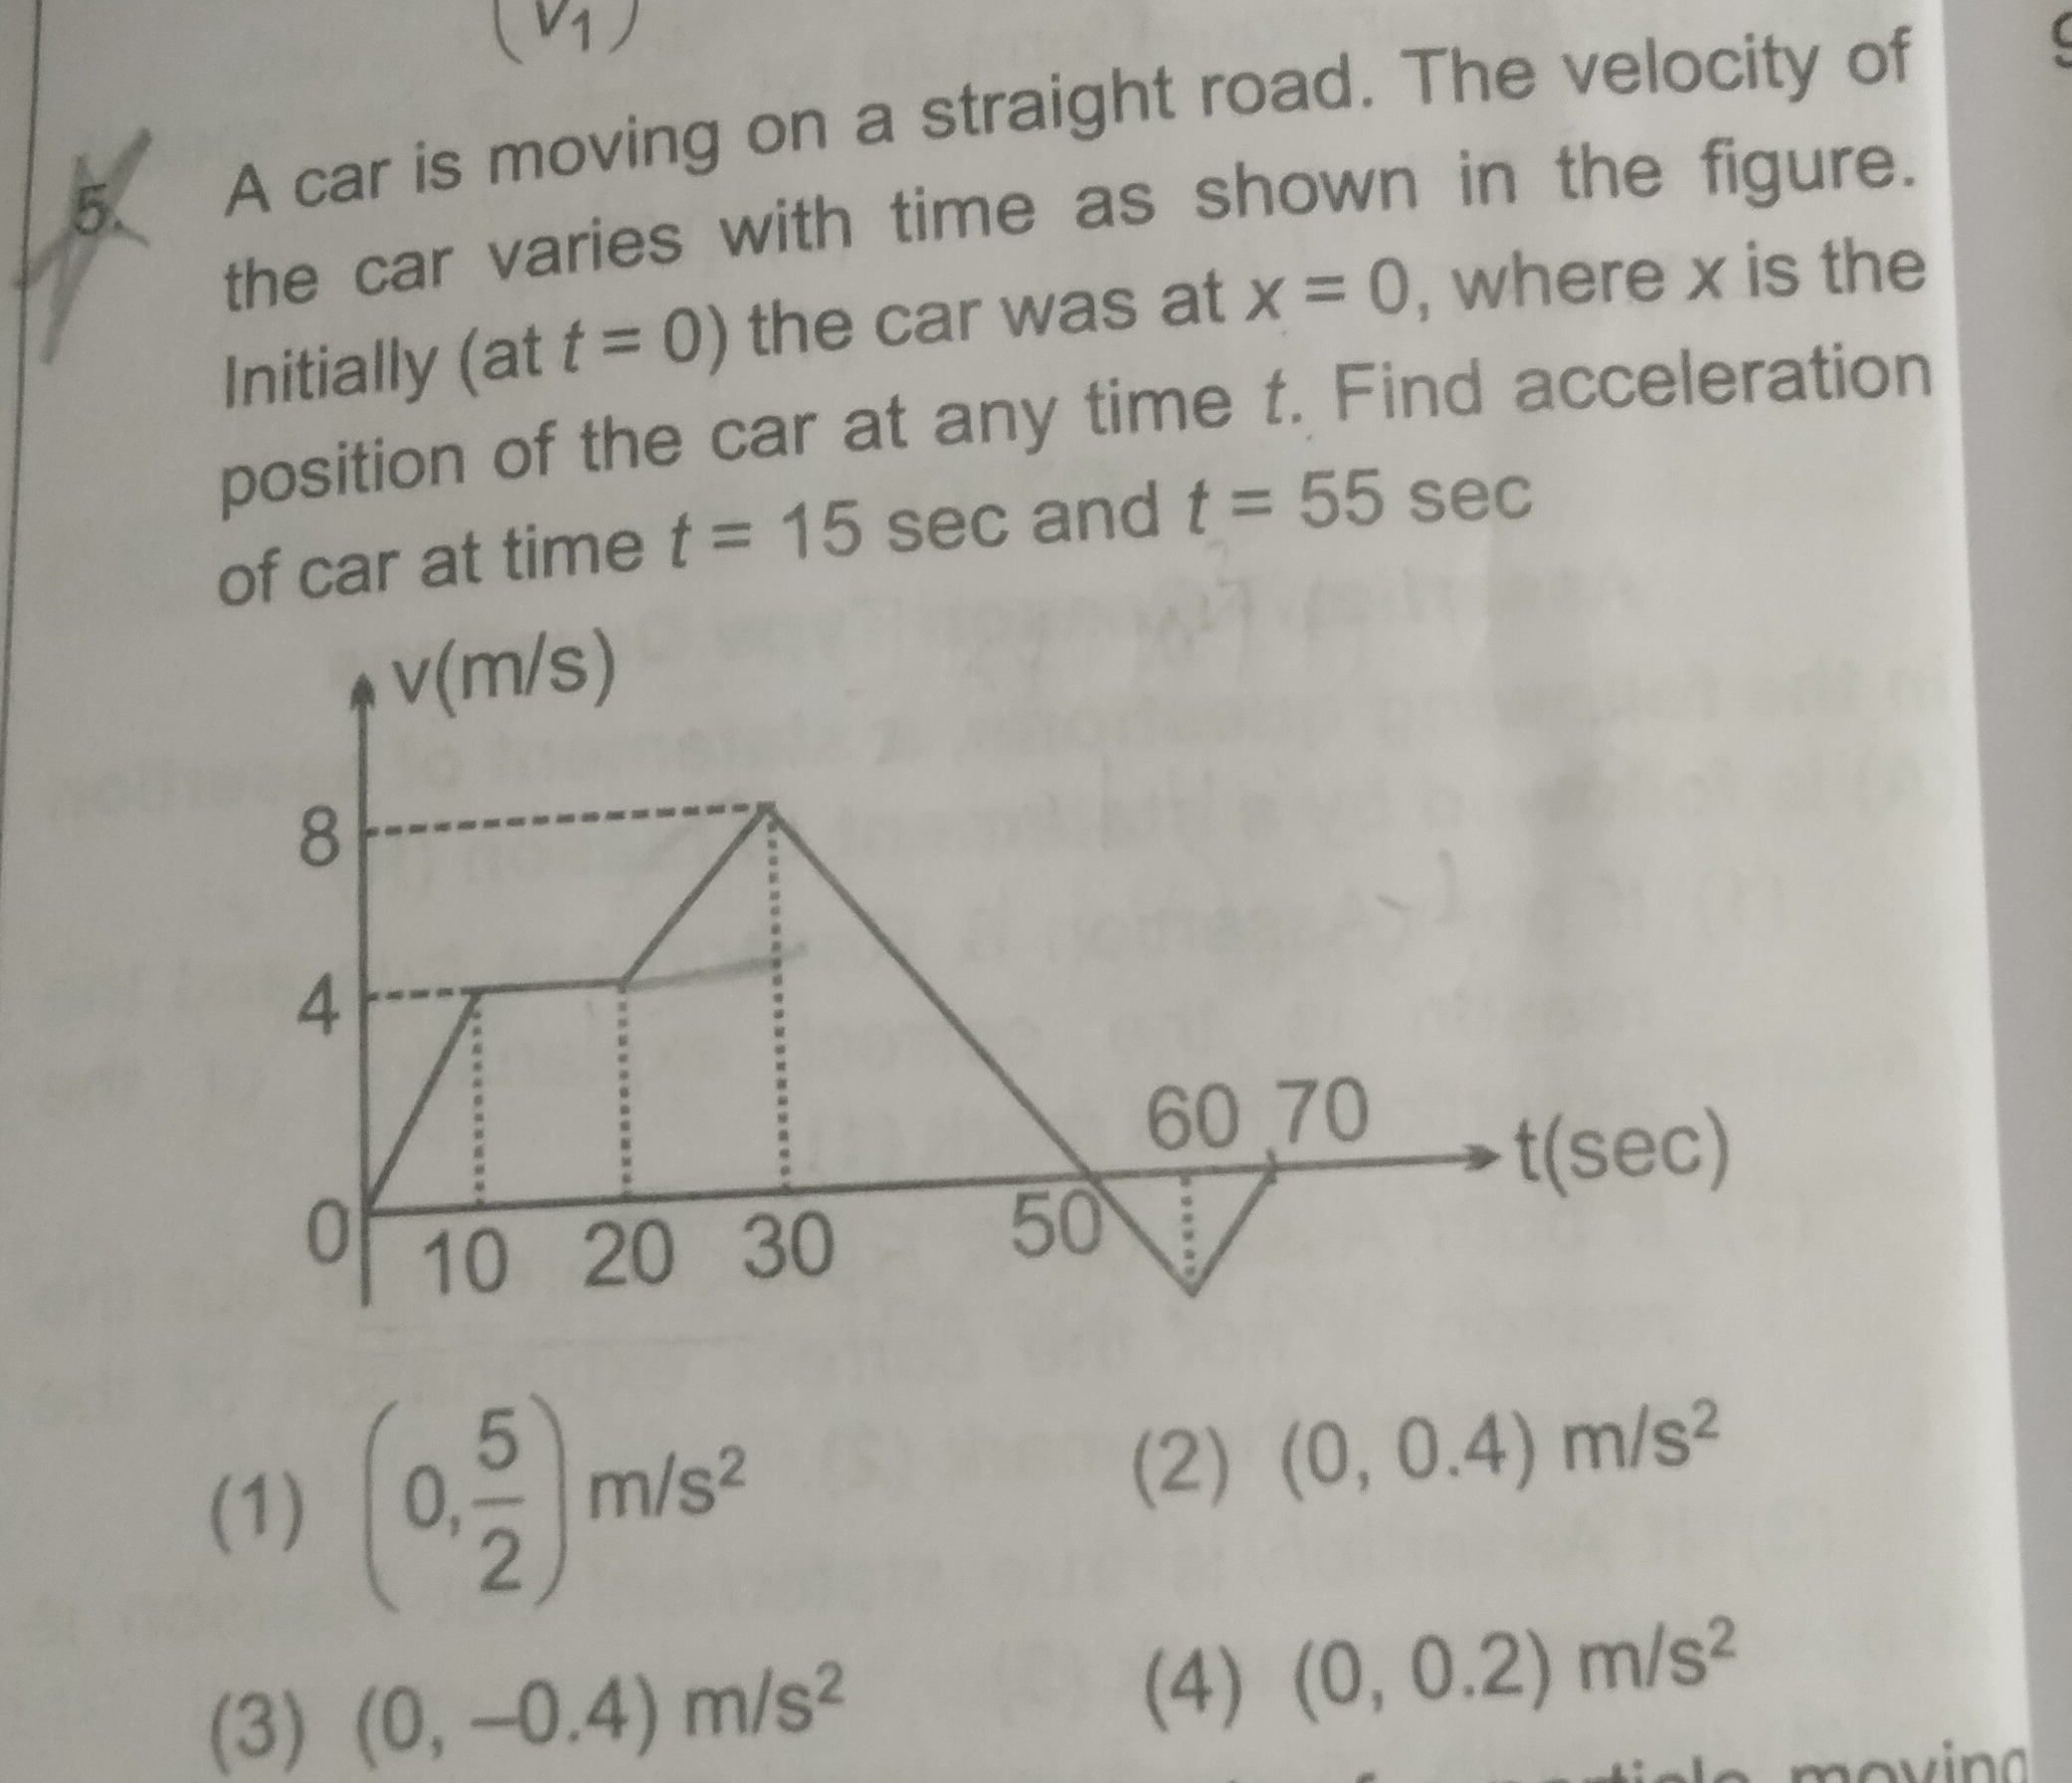
A car is moving on a straight road. The velocity of the car varies with time as shown in the figure. Initially (at t = 0) the car was at x = 0, where x is the position of the car at any time t. Find acceleration of car at time t = 15 sec and t = 55 sec
(0,25)m/s2
(0, 0.4) m/s²
(0, -0.4) m/s²
(0, 0.2) m/s²
(0, -0.4) m/s²
Solution
The acceleration of the car at any time 't' is given by the slope of the velocity-time (v-t) graph at that instant.
At t = 15 sec:
The graph segment between t = 10 sec and t = 20 sec is a horizontal line, indicating constant velocity.
Velocity at t = 10 sec is 4 m/s.
Velocity at t = 20 sec is 4 m/s.
Acceleration (a15) = Slope = ΔtΔv=20−104−4=100=0m/s2.
At t = 55 sec:
The graph segment between t = 50 sec and t = 60 sec is a straight line.
Velocity at t = 50 sec is 0 m/s.
Velocity at t = 60 sec is -4 m/s.
Acceleration (a55) = Slope = ΔtΔv=60−50−4−0=10−4=−0.4m/s2.
Thus, the accelerations are (0, -0.4) m/s².