Question
Question: A bus accelerates from rest at \[1\,{m}/{{{s}^{2}}}\;\] for 10 sec and then retards at the same rate...
A bus accelerates from rest at 1m/s2 for 10 sec and then retards at the same rate till it comes to rest. Draw a-t graph.
Solution
Using the given values of the acceleration and the time, we will draw the acceleration versus time graph. The magnitudes of the acceleration and the retardation are equal, with only the direction being opposite.
Formulae used:
a=dtdv
Complete step-by-step solution:
From the given information, we have the data as follows.
The acceleration and the retardation of the bus, 1m/s2
The time taken, 10s.
The acceleration time graph gives the value of the change in the velocity of the moving object. By finding the value of the area under the curve, the value of the change in the velocity can be obtained.
The mathematical representation of the same is, a=dtdv.
As the bus accelerates and retards at the same rate from the rest till it comes to rest, thus, we will get constant values for these situations.
For the time from 0 seconds to the 10 seconds, we get a straight line parallel to the time axis with the acceleration being a=+1m/s2. Similarly, for the time from 10 seconds to the 20 seconds, we get a straight line parallel to the time axis with the acceleration being a=−1m/s2. This negative sign indicates the decrease in the acceleration.
The acceleration versus the time graph is,
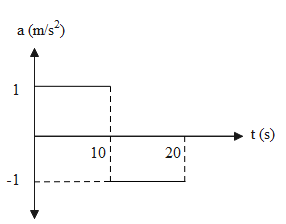
Hence the graph of acceleration versus time for a bus accelerating from the rest at 1m/s2 for 10 sec and then retarding at the same rate till it comes to rest.
Note: The distance time graph, the velocity time graph and the acceleration time graph are different for the same moving object. The magnitudes of the acceleration and the retardation are equal, with only the direction being opposite.