Question
Question: A ball is thrown vertically upwards. Which of the following plots represents the speed-time graph of...
A ball is thrown vertically upwards. Which of the following plots represents the speed-time graph of the ball during its flight if the air resistance is not ignored
A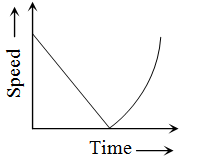
B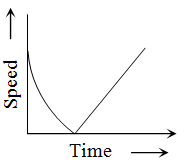
C
D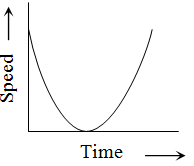
Answer
Explanation
Solution
In first half of motion the acceleration is uniform & velocity gradually decreases, so slope will be negative but for next half acceleration is positive. So slope will be positive. Thus graph 'C' is correct.
Not ignoring air resistance means upward motion will have acceleration (a + g) and the downward motion will have (g−a)