Question
Question: A bacterial infection in an internal wound grows as \(N\prime (t)={{N}_{O}}{{\exp }^{(t)}}\), where ...
A bacterial infection in an internal wound grows as N′(t)=NOexp(t), where the time ‘t’ is in hours. A dose of antibiotic, taken orally, needs one hour to reach the wound. Once it reaches there, the bacterial population goes down as dtdN=−5N2. What will be the plot of NN0 vs t after one hour?
A. 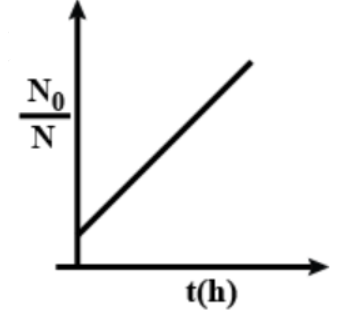
B.
C.
D.
Solution
. To solve this question, first find out the bacterial growth at time equals to one hour. The bacterial growth from one hour onwards is already given. Then find out the bacterial at time equals to t hours. You have to use integration and then find the type of equation.
Complete step by step answer:
Given that,
A bacterial infection in an internal wound grows as N′(t)=NOexp(t), where the time ‘t’ is in hours. A dose of antibiotic, which is taken orally, needs one hour to reach the wound and once it reaches there, the bacterial population becomes dtdN=−5N2. We have to find out the plot of NN0 vs t after one hour.
So, from 0 to 1 hour, the bacterial growth is N′=N0et.
So, at t=1 hour, the bacterial growth will be N′=eN0.
And from one hour onwards, the bacterial growth becomes dtdN=−5N2.
In the given equation dtdN=−5N2, let’s take N2 to the denominator in the left side and dt to the right side. Then we will get:
N2dN=−5dt
Let the bacterial growth at t time be ‘N’.
So, by integrating the above reaction from N0e to N, we will get:
N0e∫NN2dN=1∫t−5dt
Then, N0e∫NN−2dN=−51∫tdt
Then, after multiplying N0 on both side we get:
NN0−e1=5N0(t−1)
Then, NN0=5N0(t−1)+e1
And, the final equation will be:
NN0=5N0t+(e1−5N0)
Here, if we consider NN0 as y-axis, 5N0 as m, t as the x-axis and (e1−5N0) as c, the plot equation will be y=mx+c which represent an increasing straight line. And option A shows an increasing straight line (i.e. positive slope) in the plot.
So, the correct answer is “Option A”.
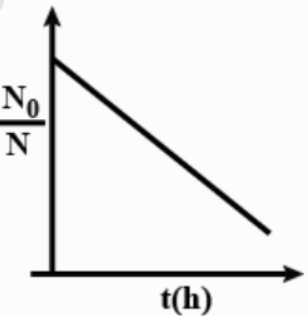
Note: The possible mistake is that you can get confused with option B which shows a negative slope but is a straight line. The plot equation for such a plot can be represented by y=mx−c and it is generally shown by a decreasing straight line in the plot.