Question
Question: A broad metal plate is connected to earth through a conducting wire as shown. An electron flies with...
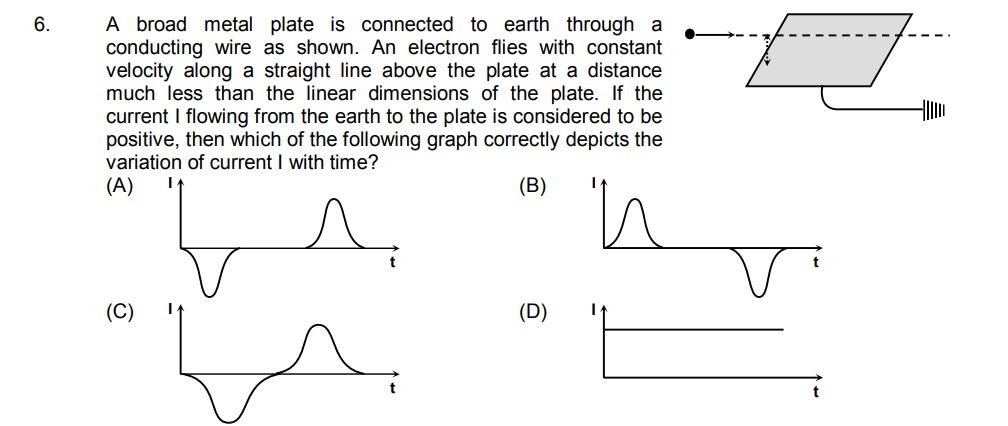
A broad metal plate is connected to earth through a conducting wire as shown. An electron flies with constant velocity along a straight line above the plate at a distance much less than the linear dimensions of the plate. If the current I flowing from the earth to the plate is considered to be positive, then which of the following graph correctly depicts the variation of current I with time?
B
Solution
The problem describes an electron flying with constant velocity along a straight line above a broad metal plate connected to earth. We need to determine the variation of current I flowing from the earth to the plate with time.
-
Induced Charge: When an electron (a negative charge,
-e) moves near a grounded conducting plate, it induces positive charges on the plate. This phenomenon can be understood using the method of images. For a point chargeqabove an infinite grounded conducting plane, the electric field in the region above the plane is equivalent to that produced by the original chargeqand an image charge-qlocated symmetrically below the plane. Since our electron has chargeq = -e, its image charge will be-(-e) = +e. -
Total Induced Charge on the Plate: The total induced charge on an infinite grounded conducting plane due to a point charge
qis-q. Therefore, for an electron with charge-e, the total induced chargeQ_indon the plate will be-(-e) = +e. This means that as the electron passes, a net positive charge is induced on the plate. -
Variation of Induced Charge with Time:
- Electron approaching (t < 0): When the electron is far away from the plate (e.g., far to the left), its influence is negligible, so the induced charge
Q_indon the plate is approximately zero. As the electron approaches the plate, positive charges are attracted from the earth onto the plate. Thus,Q_indincreases from zero. - Electron directly above (t = 0): When the electron is directly above the plate, the attractive force is strongest, and the induced positive charge
Q_indreaches its maximum value, which is+e. At this point, the rate of change of induced charge is momentarily zero. - Electron moving away (t > 0): As the electron moves away from the plate (e.g., to the right), its influence diminishes. The positive charges on the plate are no longer strongly attracted and flow back to the earth. Thus,
Q_inddecreases from its maximum value back to zero.
A graph of
Q_indversus timetwould look like a bell-shaped curve, symmetric aboutt=0, rising from 0 to+eand then falling back to 0. - Electron approaching (t < 0): When the electron is far away from the plate (e.g., far to the left), its influence is negligible, so the induced charge
-
Current
I: The currentIflowing from the earth to the plate is defined as the rate of change of charge on the plate:I = dQ_ind / dt.- Electron approaching (t < 0):
Q_indis increasing, sodQ_ind/dt > 0. This means the currentIis positive. - Electron directly above (t = 0):
Q_indis at its maximum, sodQ_ind/dt = 0. This means the currentIis zero. - Electron moving away (t > 0):
Q_indis decreasing, sodQ_ind/dt < 0. This means the currentIis negative.
Therefore, the current
Istarts at zero, increases to a positive maximum, passes through zero when the electron is directly overhead, then decreases to a negative minimum, and finally returns to zero as the electron moves far away. This shape is characteristic of the derivative of a bell-shaped curve. - Electron approaching (t < 0):
-
Matching with Graphs:
- Graph (A) shows a negative current pulse followed by a positive current pulse.
- Graph (B) shows a positive current pulse followed by a negative current pulse. This matches our analysis.
- Graph (C) shows a more complex pattern.
- Graph (D) shows a constant current, then zero.
Thus, graph (B) correctly depicts the variation of current I with time.