Question
Question: The accompanying figure depicts the change in concentration of species X and Y for the reaction X → ...
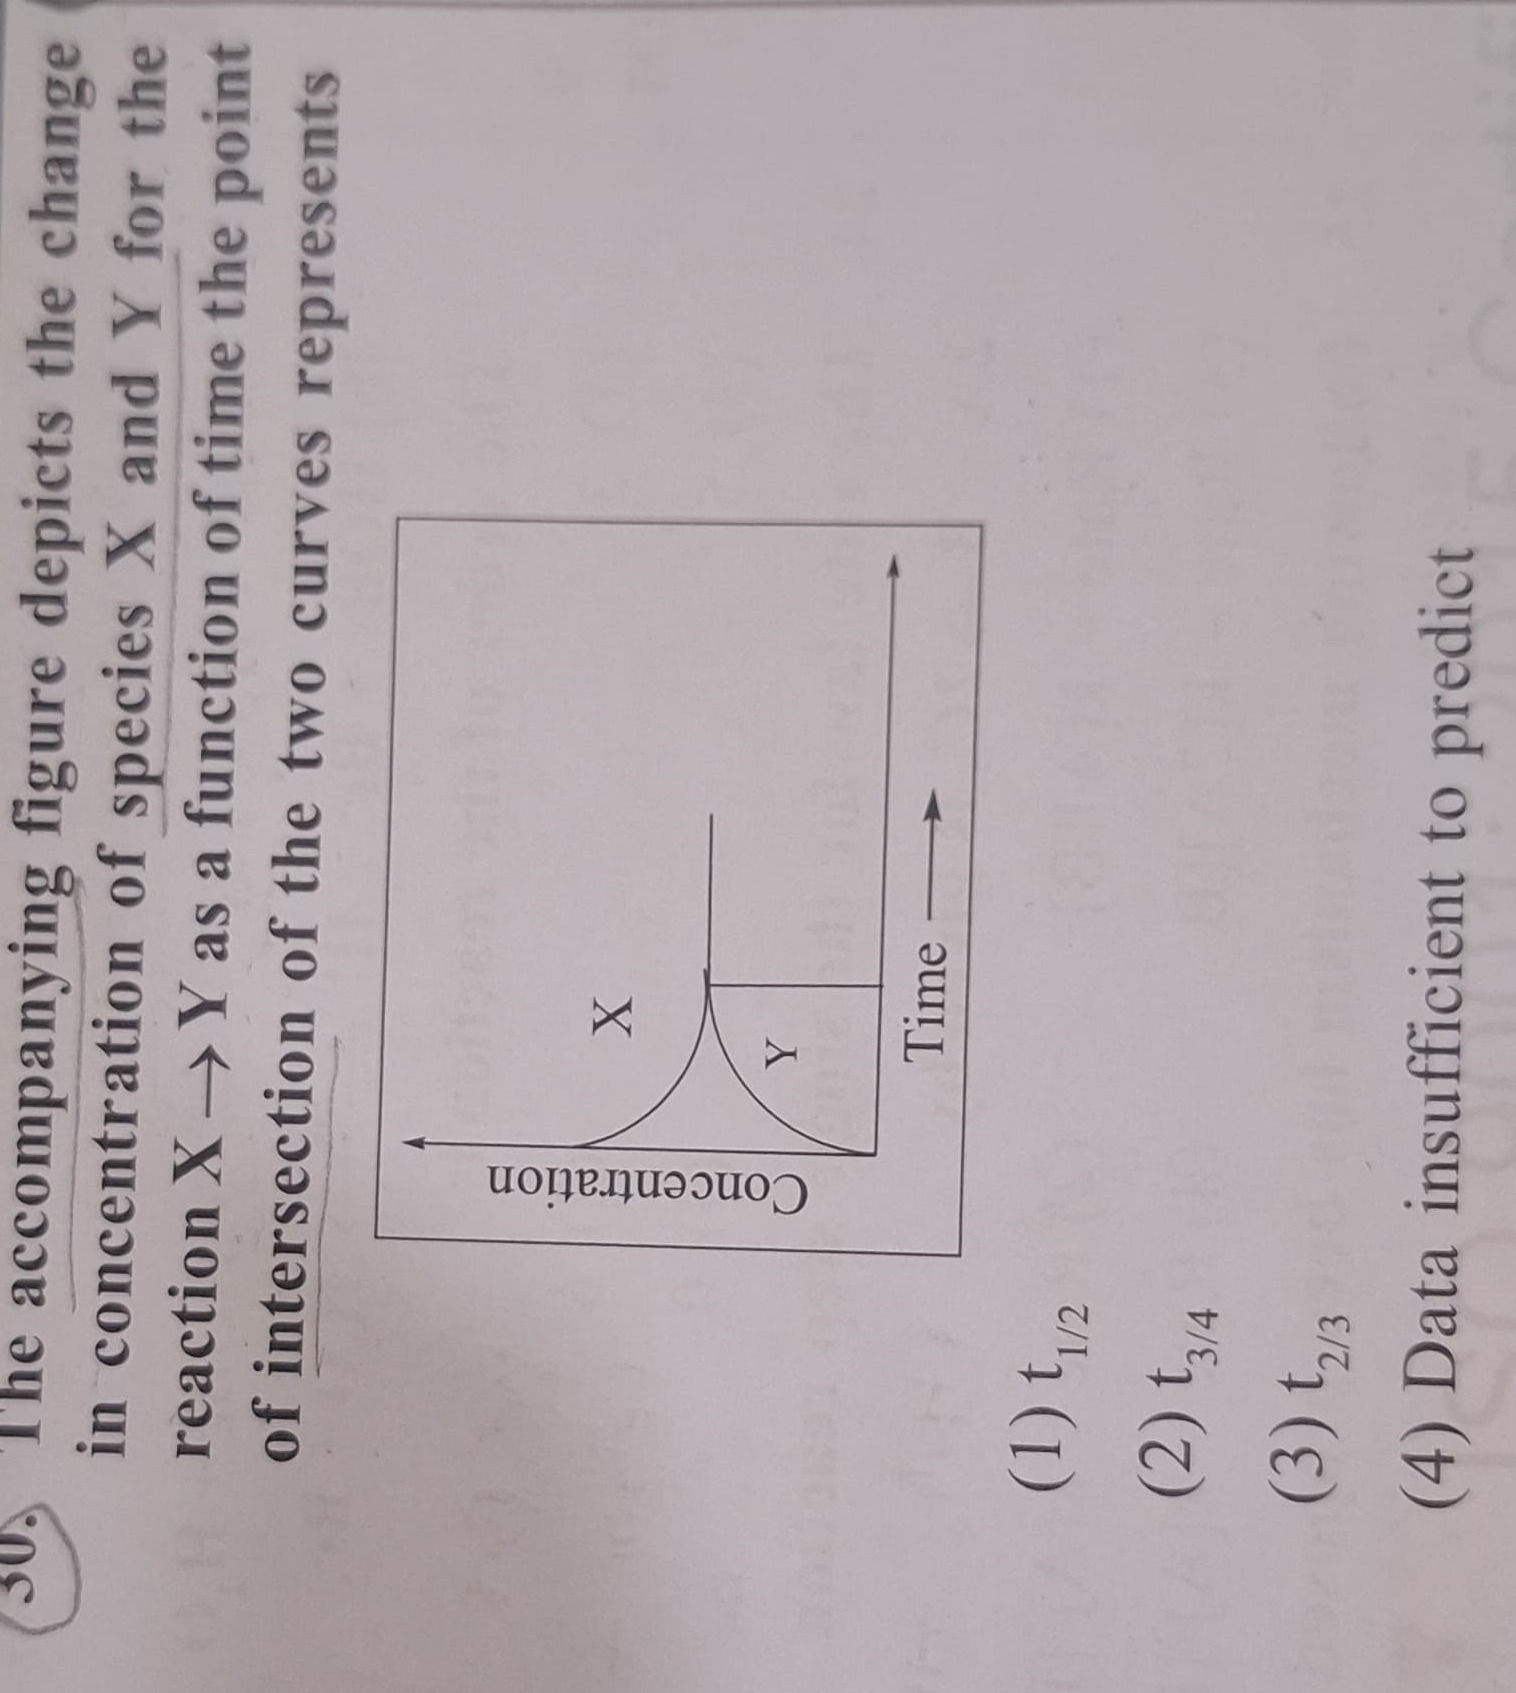
The accompanying figure depicts the change in concentration of species X and Y for the reaction X → Y as a function of time the point of intersection of the two curves represents
t1/2
t3/4
t2/3
Data insufficient to predict
t1/2
Solution
The reaction is given as X → Y. Let the initial concentration of X be [X]0 and the initial concentration of Y be [Y]0. From the graph, it is clear that at time t=0, the concentration of Y is zero, so [Y]0=0.
As the reaction proceeds, X is consumed and Y is formed. Assuming a 1:1 stoichiometry as given by the reaction equation, the decrease in the concentration of X is equal to the increase in the concentration of Y.
At any time t, let the concentration of X be [X]t and the concentration of Y be [Y]t. The amount of X reacted is [X]0−[X]t. This amount is converted to Y. So, the concentration of Y formed is [Y]t−[Y]0. Since [Y]0=0, we have [Y]t=[X]0−[X]t. This equation represents the conservation of mass for the reaction, i.e., the sum of the concentrations of reactant and product at any time is equal to the initial concentration of the reactant (assuming the volume is constant and the initial concentration of the product is zero). [X]t+[Y]t=[X]0
The point of intersection of the two curves represents the time when the concentration of X is equal to the concentration of Y. Let this time be tint. At t=tint, [X]tint=[Y]tint.
Substituting this into the mass balance equation: [X]tint+[X]tint=[X]0 2[X]tint=[X]0 [X]tint=2[X]0
So, at the time of intersection, the concentration of reactant X has decreased to half of its initial concentration. By definition, the time required for the concentration of a reactant to decrease to half of its initial concentration is called the half-life, denoted as t1/2.
Therefore, the time at which the concentration of X is equal to the concentration of Y is the half-life of the reaction, t1/2.