Question
Question: A uniform dense rod with non uniform young's modulus is hanging from ceiling under gravity. If elast...
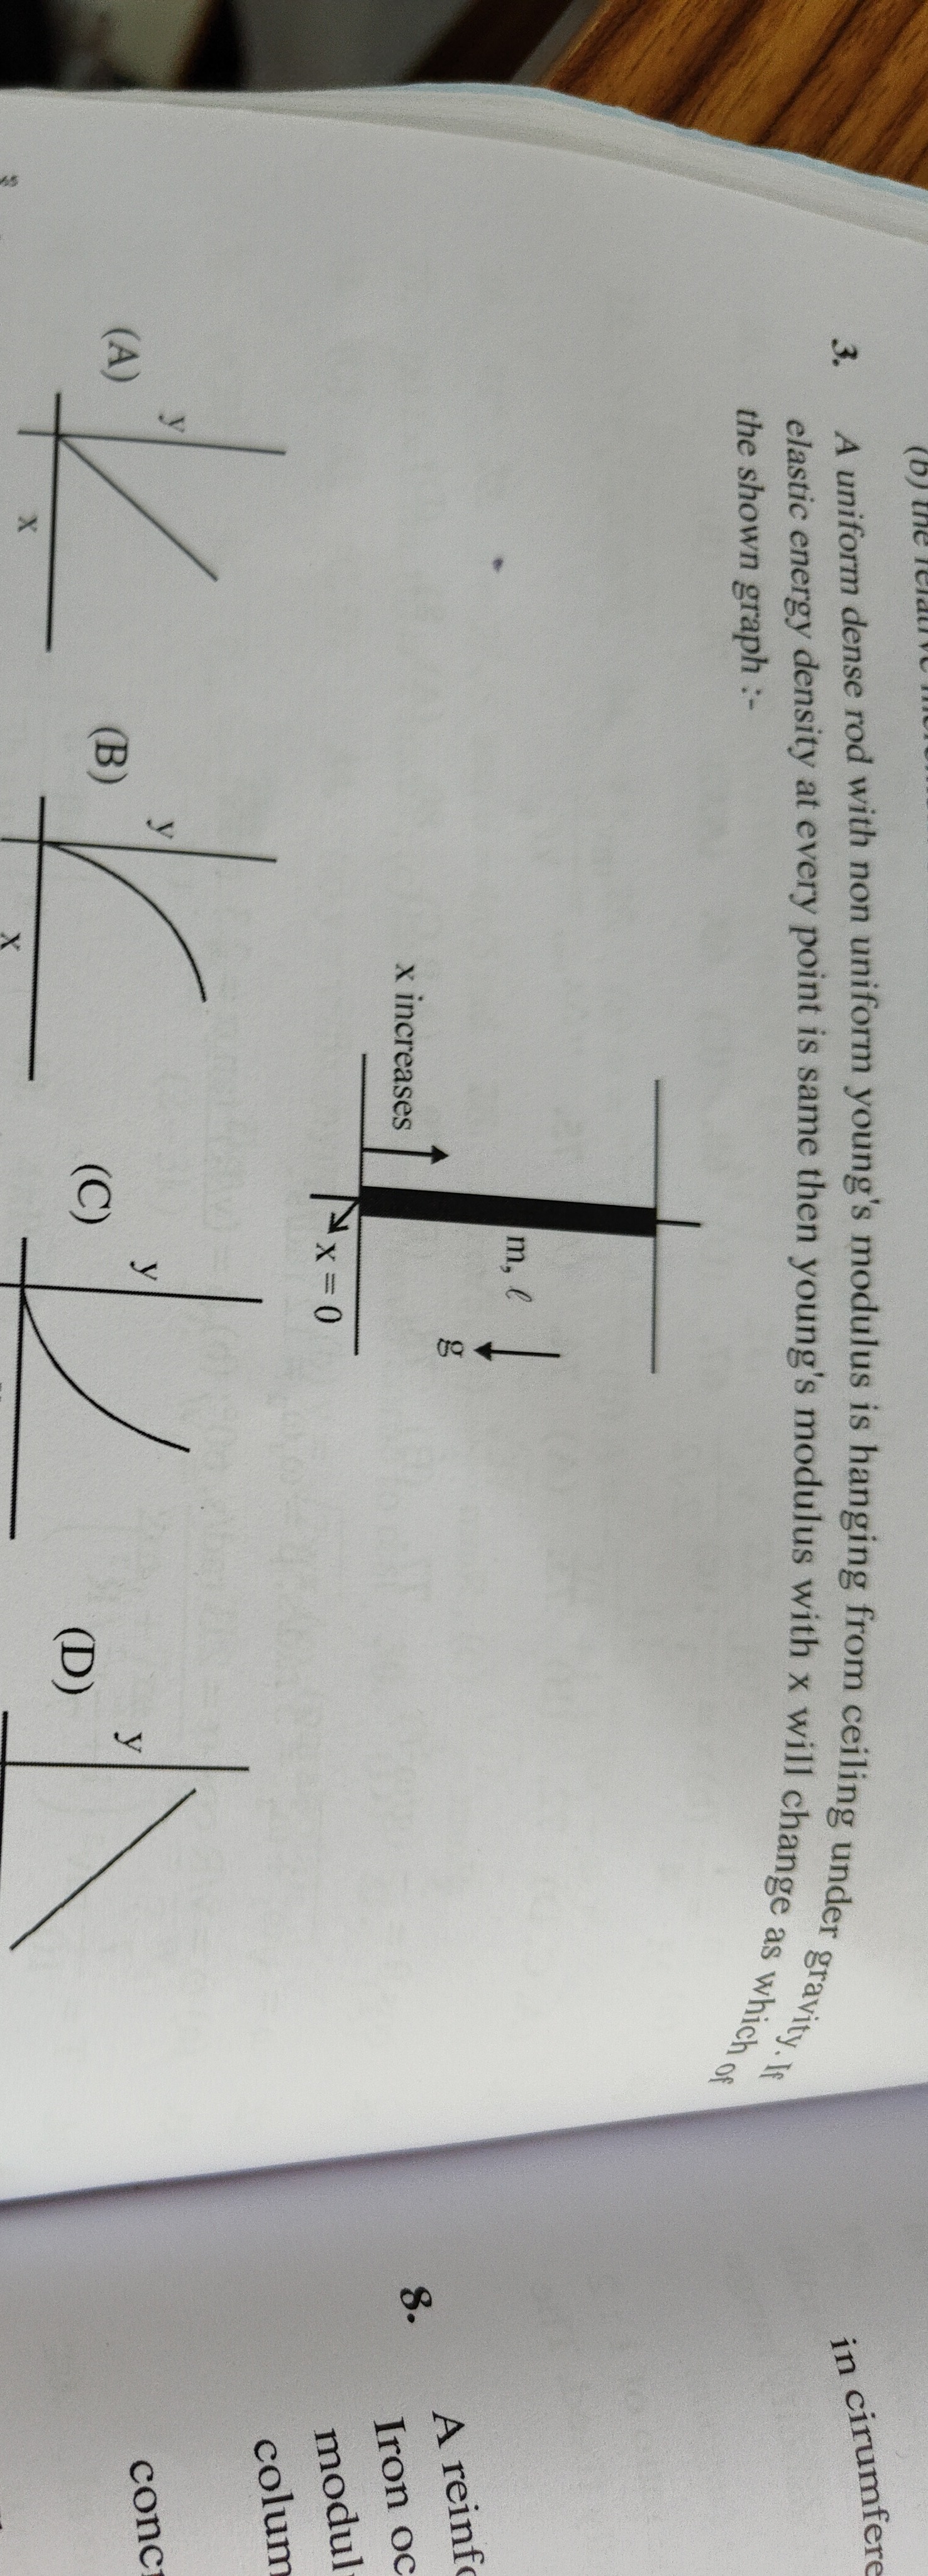
A uniform dense rod with non uniform young's modulus is hanging from ceiling under gravity. If elastic energy density at every point is same then young's modulus with x will change as which of the shown graph :-
A
B
C
D
C
Solution
Let the rod have length l, mass m, and constant cross-sectional area A. Let x be the distance measured from the top end of the rod (hanging from the ceiling), so x=0 at the top and x=l at the bottom. The rod has a uniform density ρ.
The tension T(x) at a point x is the weight of the rod below that point. The mass of the segment from x to l is dm=ρAdx. The weight of this segment is dF=dm⋅g=ρAgdx. The total tension at x is T(x)=∫xlρAgdx=ρAg(l−x).
The stress σ(x) at position x is σ(x)=AT(x)=ρg(l−x). The strain ϵ(x) at position x is given by ϵ(x)=Y(x)σ(x), where Y(x) is the Young's modulus at position x. So, ϵ(x)=Y(x)ρg(l−x).
The elastic energy density u(x) at position x is given by u(x)=21σ(x)ϵ(x). Substituting the expressions for σ(x) and ϵ(x): u(x)=21(ρg(l−x))(Y(x)ρg(l−x))=2Y(x)(ρg(l−x))2.
We are given that the elastic energy density u(x) is the same at every point, so u(x)=u0, where u0 is a constant. u0=2Y(x)ρ2g2(l−x)2.
We need to find how Y(x) changes with x. Rearranging the equation for Y(x): Y(x)=2u0ρ2g2(l−x)2.
Since ρ, g, and u0 are constants, we can write Y(x)=C(l−x)2, where C=2u0ρ2g2 is a positive constant.
We need to find the graph that represents Y(x)=C(l−x)2 for x in the range [0,l].
- At x=0 (top of the rod), Y(0)=C(l−0)2=Cl2. This is the maximum value of Young's modulus.
- At x=l (bottom of the rod), Y(l)=C(l−l)2=0. This is the minimum value of Young's modulus.
- The function Y(x) is a decreasing function of x in the range [0,l].
- To determine the concavity, we find the second derivative of Y(x) with respect to x: dxdY=C⋅2(l−x)⋅(−1)=−2C(l−x). dx2d2Y=−2C(−1)=2C. Since C>0, dx2d2Y>0. This means the graph of Y(x) versus x is concave up.
Observing the given graphs:
- Graph (A) shows a linear increase.
- Graph (B) shows a rapid decrease, resembling an inverse relationship.
- Graph (C) shows a decrease from a high value to a low value, and the curve is bending upwards (concave up).
- Graph (D) shows a decrease from a high value to a low value, and the curve is bending downwards (concave down).
Graph (C) correctly represents a function that is decreasing and concave up, matching our derived function Y(x)=C(l−x)2.