Question
Question: The ends of a metallic bar are maintained at different temperature. In the steady state the temperat...
The ends of a metallic bar are maintained at different temperature. In the steady state the temperature variation along the length of the bar is shown in the figure. This could possibly be due to :
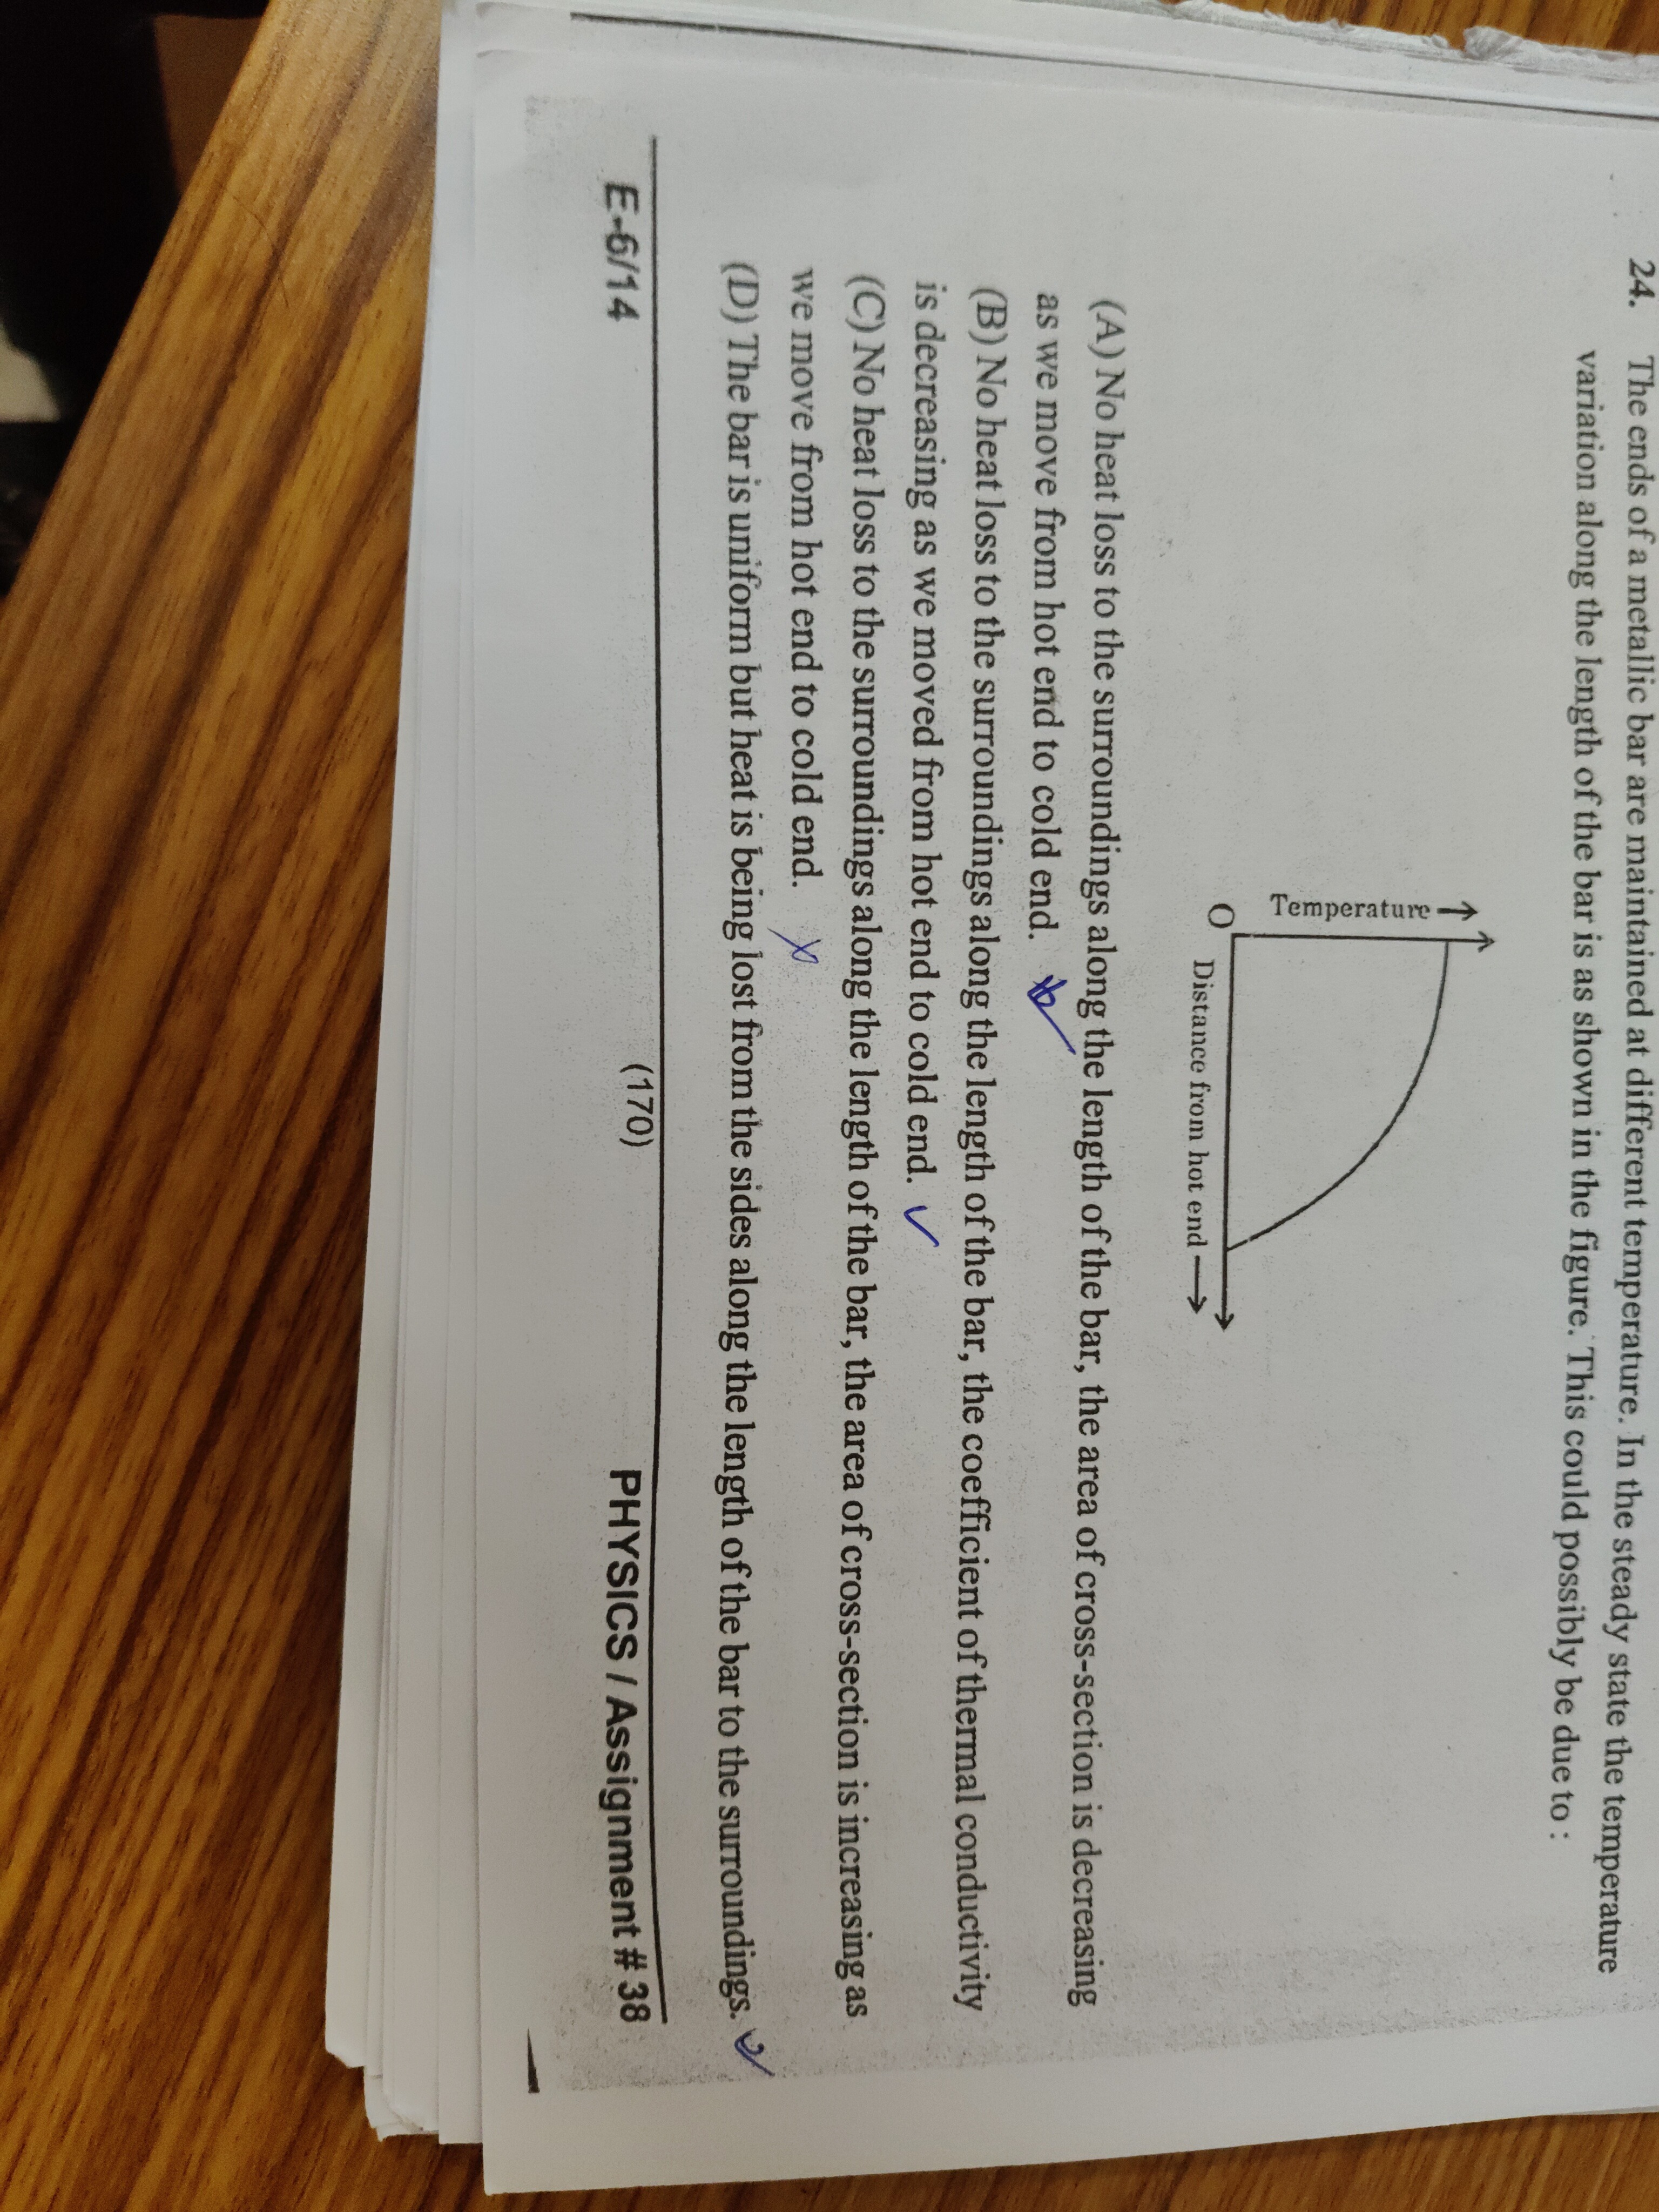
No heat loss to the surroundings along the length of the bar, the area of cross-section is decreasing as we move from hot end to cold end.
No heat loss to the surroundings along the length of the bar, the coefficient of thermal conductivity is decreasing as we moved from hot end to cold end.
No heat loss to the surroundings along the length of the bar, the area of cross-section is increasing as we move from hot end to cold end.
The bar is uniform but heat is being lost from the sides along the length of the bar to the surroundings.
The correct options are (C) and (D).
Solution
In steady state, the rate of heat flow P through a bar is given by Fourier's Law: P=−kAdxdT, where k is thermal conductivity, A is the cross-sectional area, and dxdT is the temperature gradient. The graph shows that the temperature decreases with distance from the hot end, meaning dxdT is negative. The curve is concave up, which means dx2d2T>0. This implies that the magnitude of the temperature gradient, ∣dxdT∣, decreases as we move from the hot end to the cold end.
Case 1: No heat loss to surroundings (Options A, B, C) In this case, P is constant along the length of the bar. So, P=−kAdxdT=constant. If the material is uniform, k is constant. Then AdxdT=constant. Let this constant be −C (since dxdT is negative). So, AdxdT=−C, which means dxdT=−AC. The magnitude of the temperature gradient is ∣dxdT∣=AC. Since ∣dxdT∣ decreases as x increases (from hot to cold end), the cross-sectional area A must increase as x increases. This corresponds to option (C). Option (A) suggests decreasing area, which would mean ∣dxdT∣ increases, contradicting the graph. Option (B) suggests decreasing thermal conductivity. If A is constant and k decreases, then ∣dxdT∣=kAP would increase, contradicting the graph.
Case 2: Heat loss from the sides (Option D) If the bar is uniform (k and A are constant) and heat is lost from the sides to the surroundings at temperature Tsurr, the heat conduction equation becomes dx2d2T=α2(T−Tsurr), where α2=kAhS (h is the heat transfer coefficient, S is the surface area per unit length). If the temperature of the bar T is greater than the surrounding temperature Tsurr, then dx2d2T>0, which means the temperature profile is concave up. This is consistent with the given graph.
Both option (C) and option (D) describe conditions that can lead to the observed temperature variation.