Question
Question: The following figure shows stress-strain graphs of two metals A and B. From the graphs it can be con...
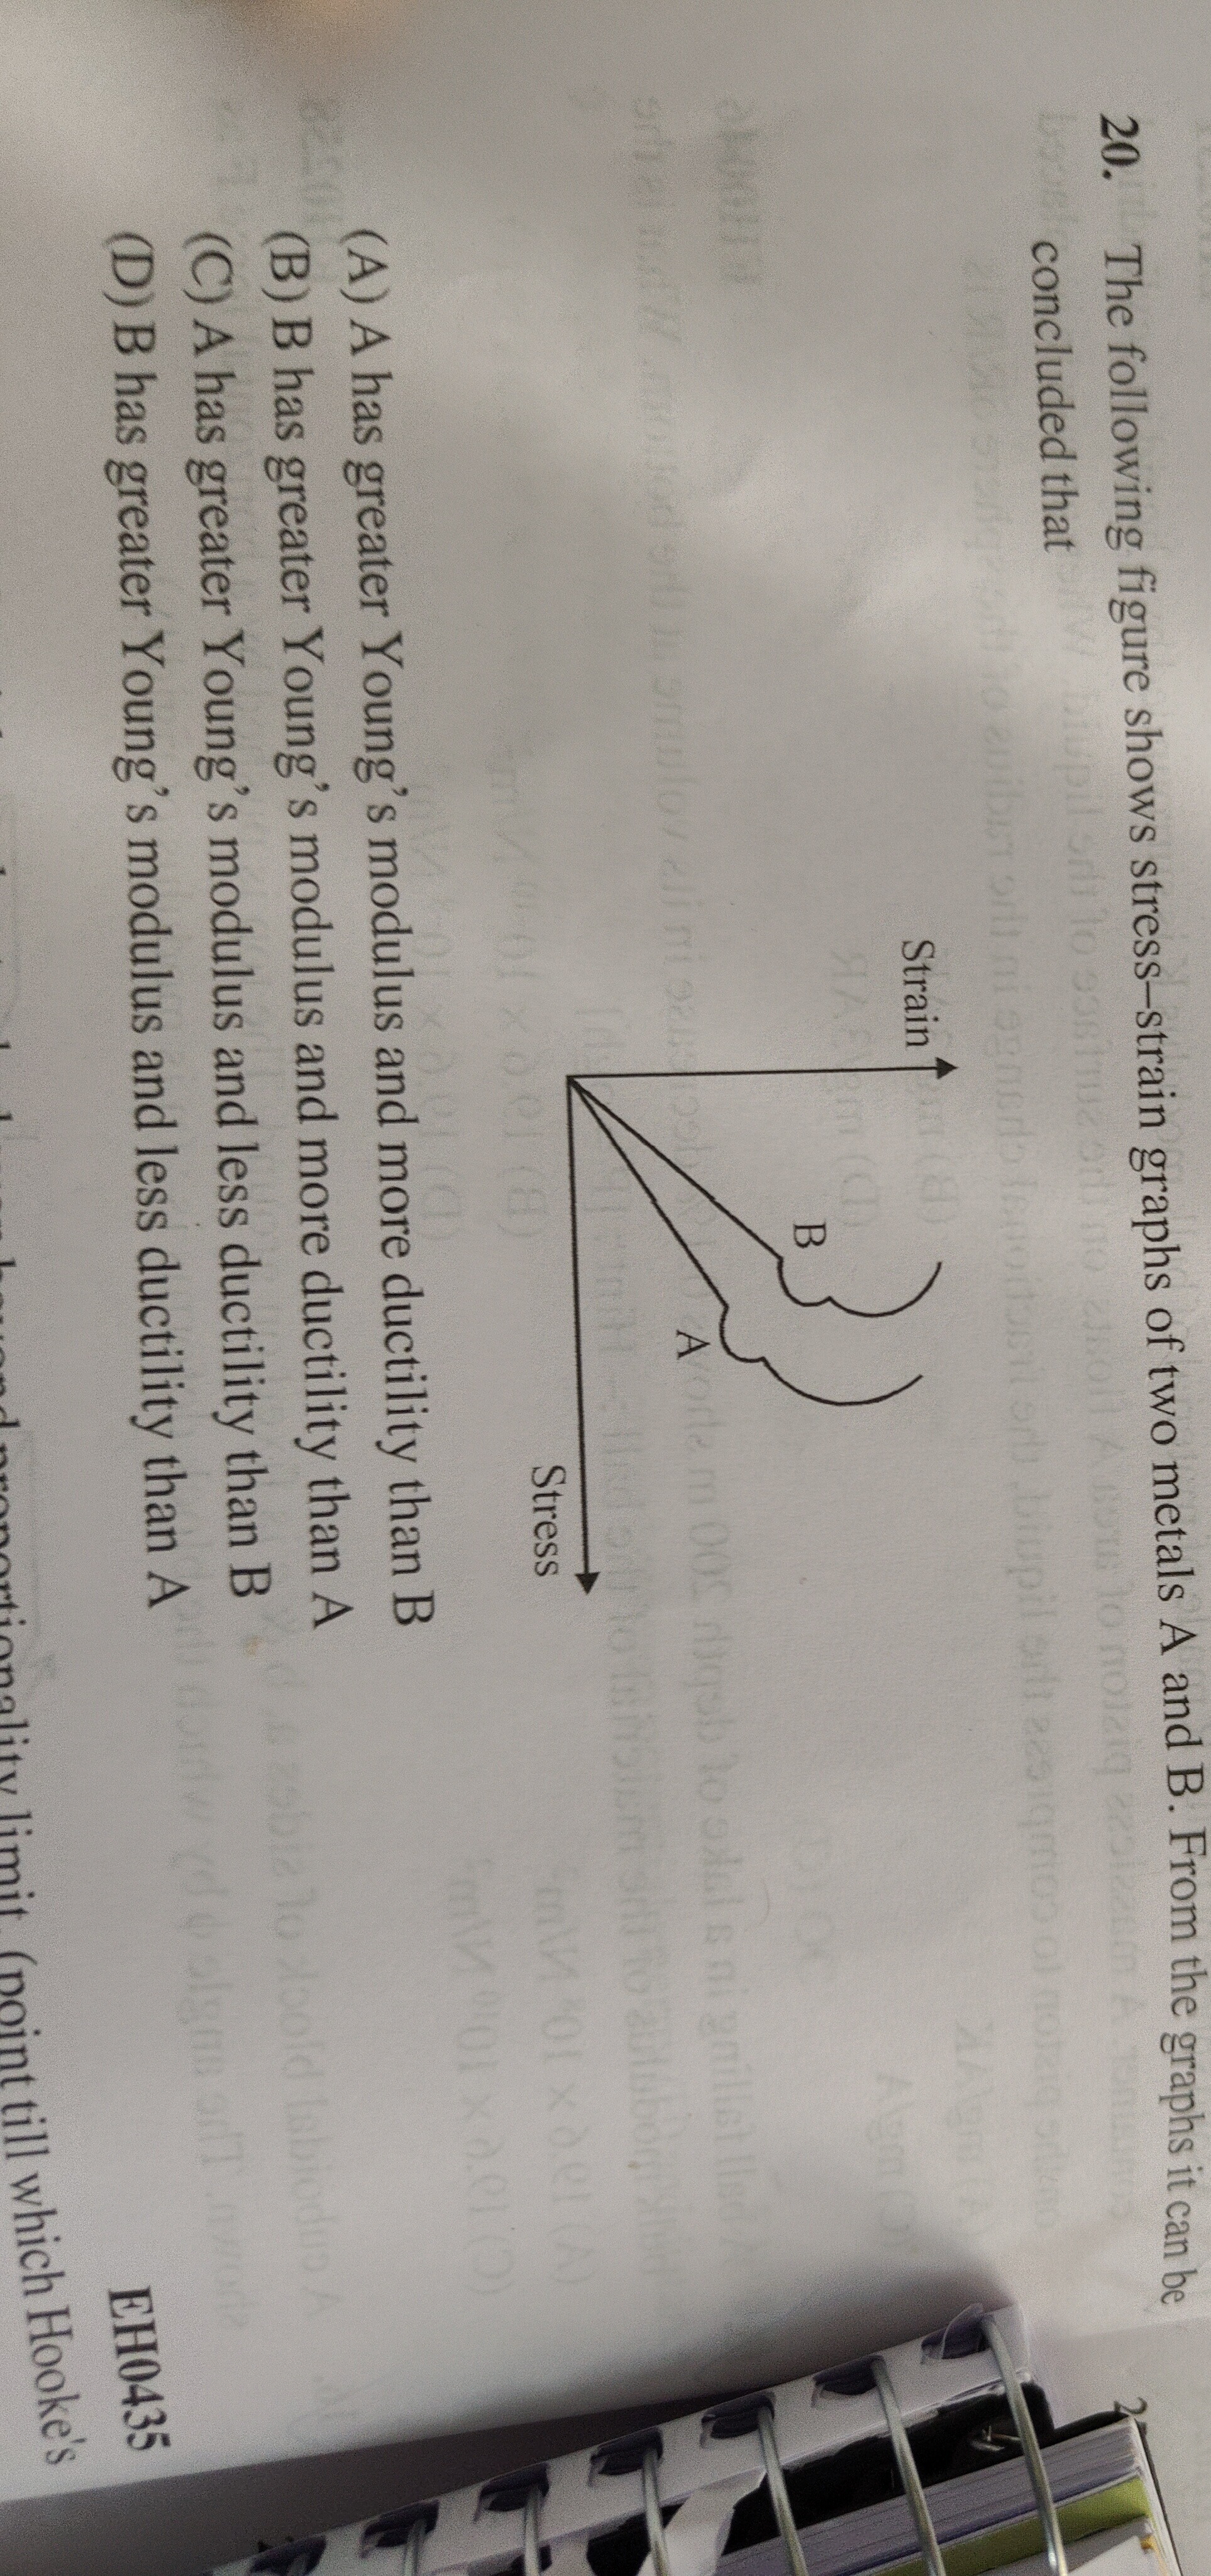
The following figure shows stress-strain graphs of two metals A and B. From the graphs it can be concluded that
A has greater Young's modulus and more ductility than B
B has greater Young's modulus and more ductility than A
A has greater Young's modulus and less ductility than B
B has greater Young's modulus and less ductility than A
A has greater Young's modulus and less ductility than B
Solution
Young's modulus (Y) is a measure of a material's stiffness and is represented by the slope of the stress-strain curve in the elastic region. Mathematically, Y=StrainStress. In the given graph, stress is plotted on the vertical axis and strain on the horizontal axis. The slope of the linear portion of the curve for metal A is steeper than that for metal B. Therefore, metal A has a greater Young's modulus than metal B (YA>YB).
Ductility is the ability of a material to deform plastically under tensile stress without fracturing. This is indicated by the extent of strain in the plastic region of the stress-strain curve. Metal A's curve is a straight line, suggesting it breaks with little or no plastic deformation, making it less ductile. Metal B's curve shows a significant extension in the plastic region (the curved part after the linear elastic region) before reaching its fracture point. Thus, metal B is more ductile than metal A.
Combining these observations, metal A has a greater Young's modulus and less ductility than metal B.