Question
Question: Which of the following graphs is correct between kinetic energy (E), potential energy (U) and height...
Which of the following graphs is correct between kinetic energy (E), potential energy (U) and height (h) from the ground of the particle
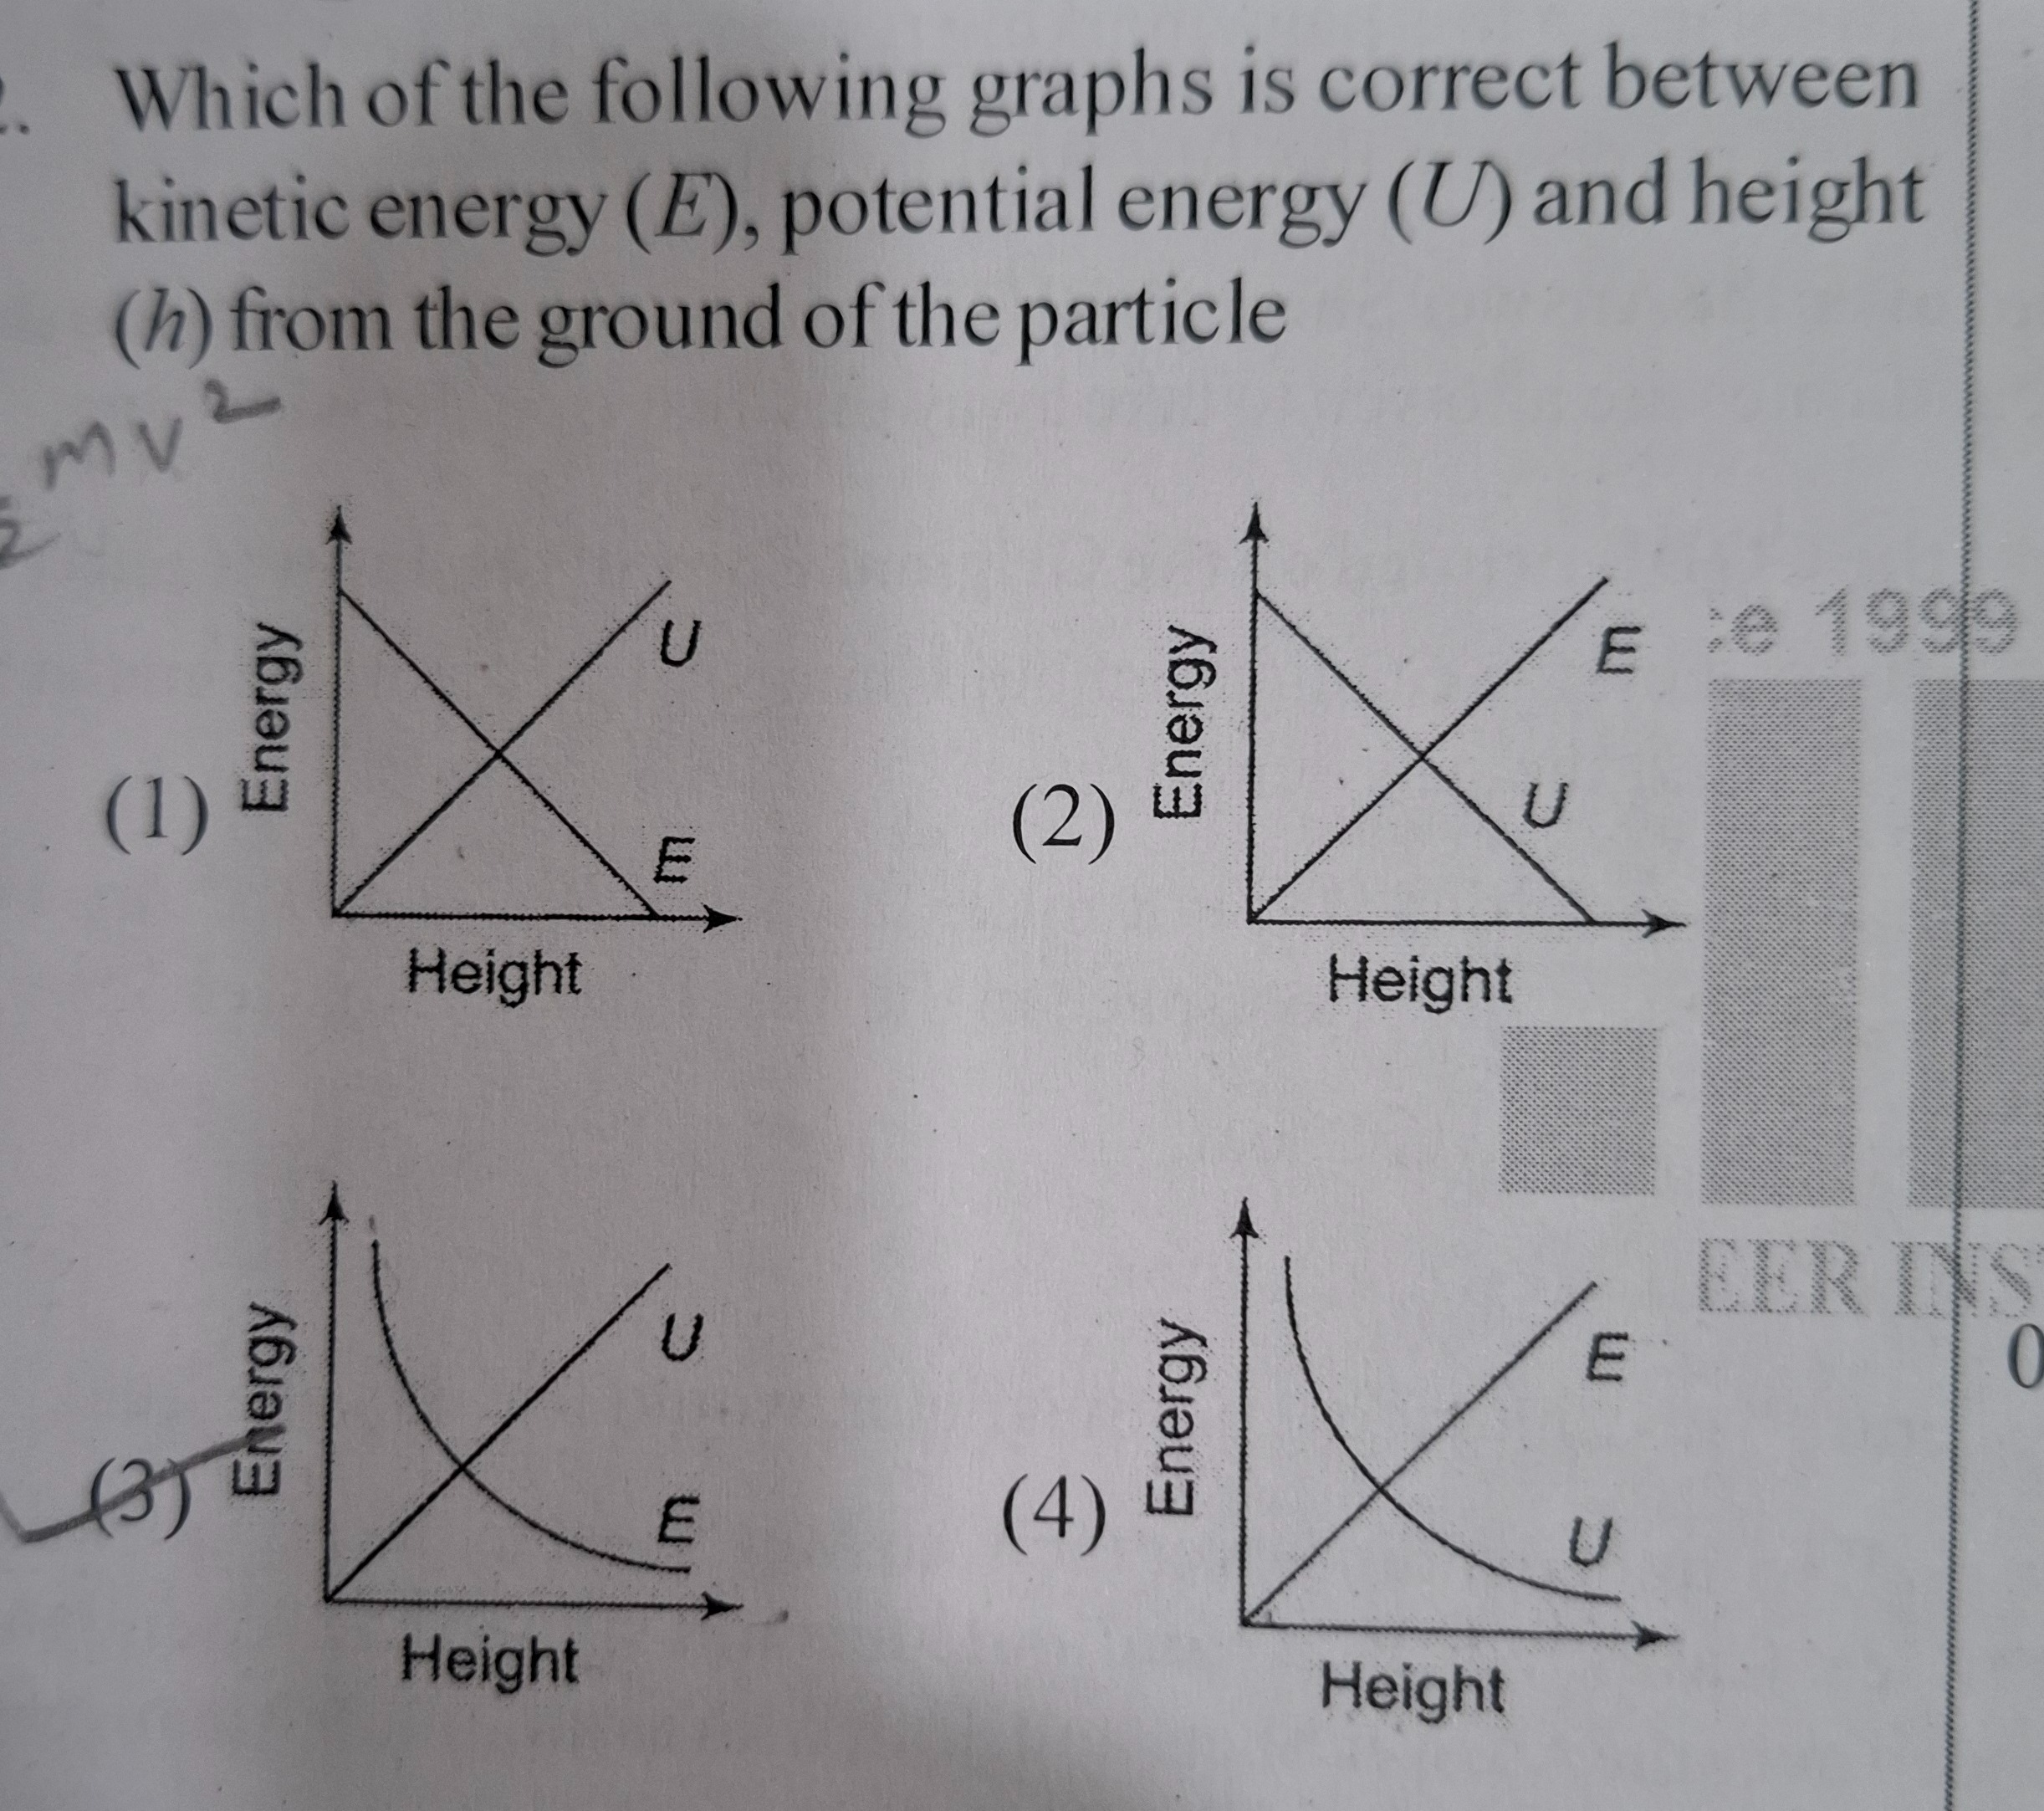
Graph (1)
Graph (2)
Graph (3)
Graph (4)
1
Solution
For a particle of mass 'm' at a height 'h' from the ground, under the influence of gravity and neglecting air resistance:
-
Potential Energy (U): The gravitational potential energy is given by the formula: U=mgh Since 'm' and 'g' are constants, potential energy (U) is directly proportional to height (h). This means the graph of U versus h should be a straight line passing through the origin with a positive slope. As height 'h' increases, potential energy 'U' also increases linearly.
-
Kinetic Energy (E): According to the principle of conservation of mechanical energy, the sum of kinetic energy (E) and potential energy (U) remains constant throughout the motion, provided only conservative forces (like gravity) are doing work. E+U=Total Mechanical Energy (TME)=constant Therefore, E=TME−U Substituting U=mgh: E=TME−mgh This equation shows that kinetic energy (E) is linearly dependent on height (h) with a negative slope. As height 'h' increases, potential energy 'U' increases, and consequently, kinetic energy 'E' must decrease linearly to keep the total mechanical energy constant.
At h = 0 (ground level), U = 0, and E = TME (maximum kinetic energy). At the maximum height, E = 0, and U = TME (maximum potential energy).
Therefore, Graph (1) is the correct representation.
Potential energy (U=mgh) increases linearly with height (h), so its graph is a straight line with a positive slope starting from the origin. Kinetic energy (E=TME−mgh) decreases linearly with height (h) because total mechanical energy (TME) is conserved. Its graph is a straight line with a negative slope, starting from a maximum at h=0 and decreasing to zero at the maximum height. Option (1) correctly depicts these linear relationships where U increases and E decreases with height, and their sum remains constant.