Question
Question: Which of the following plots is(are) correct for the given reaction? ([P]$_0$ is the initial concen...
Which of the following plots is(are) correct for the given reaction?
([P]0 is the initial concentration of P)
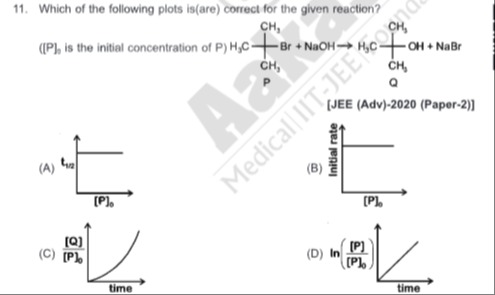
Plot of t1/2 vs [P]0
Plot of Initial rate vs [P]0
Plot of [P]0[Q] vs time
Plot of ln([P]0[P]) vs time
(A), (D)
Solution
The reaction is of tert-butyl bromide with NaOH, which is a tertiary alkyl halide. Tertiary alkyl halides undergo nucleophilic substitution via an SN1 mechanism. The SN1 mechanism involves the formation of a carbocation in the rate-determining step, which is unimolecular. The rate law for an SN1 reaction is Rate = k[P], indicating a first-order reaction with respect to the alkyl halide (P).
Let's analyze each plot:
(A) Plot of t1/2 vs [P]0 For a first-order reaction, the half-life is t1/2=kln2. This is independent of the initial concentration [P]0. Thus, a plot of t1/2 versus [P]0 should be a horizontal line, which is correctly represented in plot (A).
(B) Plot of Initial rate vs [P]0 For a first-order reaction, the initial rate is Rate = k[P]0. This implies a direct proportionality between the initial rate and [P]0. Plot (B) shows the rate as constant, independent of [P]0, which is incorrect for a first-order reaction.
(C) Plot of [P]0[Q] vs time For a first-order reaction, the concentration of product Q at time t is [Q]t=[P]0(1−e−kt). Therefore, [P]0[Q]t=1−e−kt. This function starts at 0 and increases asymptotically towards 1. The curve is concave down (dt2d2f<0). Plot (C) shows a concave up curve, making it incorrect.
(D) Plot of ln([P]0[P]) vs time For a first-order reaction, [P]t=[P]0e−kt, so [P]0[P]t=e−kt. Taking the natural logarithm, ln([P]0[P]t)=−kt. This represents a straight line with a negative slope (-k) passing through the origin. Plot (D) shows a straight line with a positive slope. However, it is a common convention or a slight mislabeling to represent ln([P][P]0) vs time, which equals kt. Assuming this common representation, plot (D) would be considered correct as it depicts a linear relationship with time.
Therefore, plots (A) and (D) are correct, assuming the common interpretation for plot (D).